

VM Reporting & Dashboards (What it should look like for retail leaders)

Most retail organizations already have VM reports. What they often lack is VM visibility.
Spreadsheets, audit scores, and regional summaries are routinely shared upward. Yet at the executive level, these reports rarely answer the questions that matter most:
Where are we structurally breaking? Why do the same issues repeat? And where should leadership attention actually go?
VM reporting for retail leaders should not be a record of activity. It should be a tool for prioritization.
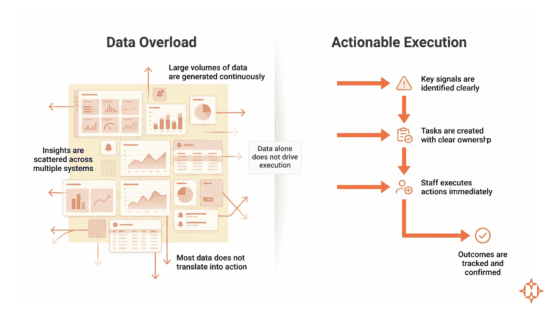
Why traditional VM reporting fails leadership teams
Most VM reporting is designed bottom up. It focuses on compliance capture, not executive decision making.
Typical VM reports emphasize:
- Percentage compliance by store or region
- Audit pass or fail snapshots
- Campaign level completion rates
While useful at an operational level, these views lack context. They show what happened, but not why it keeps happening.
Across large retail networks, internal reviews often reveal:
- 20–30 percent of stores account for the majority of repeated VM deviations
- The same VM issues reappear across campaigns, even when audit scores temporarily improve
Traditional reports flatten these patterns into averages, masking structural risk.
How traditional VM reports differ from executive-ready dashboards
The limitation becomes clearer when comparing how traditional reports differ from decision-oriented dashboards.
| Aspect | Traditional VM reporting | Executive VM dashboards |
| Primary focus | Activity tracking | Decision prioritization |
| Data structure | Store-level scores | Pattern and trend visibility |
| Time perspective | Point-in-time snapshots | Continuous, time-based insights |
| Issue visibility | Averages and summaries | Exception and concentration-driven |
| Leadership value | Informational | Actionable |
This difference is what determines whether reporting drives oversight or actual intervention.
What CXOs actually need from VM reporting
At an executive level, VM reporting should function like a risk radar, not a scorecard.
Effective CXO dashboards answer three questions clearly:
- Where is VM execution breaking persistently?
- What is the business impact of those breakdowns?
- Which interventions will produce the highest return on effort?
This requires moving beyond static compliance metrics.
From store level scores to network level insight
Store level compliance percentages are useful for managers. CXOs need aggregation that reveals concentration.
High value VM dashboards highlight:
- Which stores deviate most frequently, not just currently
- Which VM elements fail repeatedly across time
- How deviations cluster by store format, region, or workload
In practice, retailers that reframe reporting this way often discover that:
- 25–40 percent of all VM misses originate from the same subset of locations
- Blanket enforcement across the network produces diminishing returns
This insight allows leadership to intervene surgically instead of broadly.
Time based visibility changes the conversation
Most VM reporting is event based. Audits happen, scores are logged, and the moment passes.
What is often missing is time.
Without time based context, leaders cannot see:
- How long VM deviations persist before correction
- Whether fixes occur before or after peak selling hours
- Which issues self correct versus those that remain chronic
When VM reporting incorporates time as a dimension, patterns emerge quickly. Issues that appear minor in audits reveal themselves as long running revenue leaks.
In several retail networks, time based VM analysis has shown that:
- A significant share of VM issues remain unresolved for 3–7 days before correction
- Many fixes occur after the highest footfall windows have already passed
This reframes VM from a compliance problem to a lost opportunity problem.
Connecting VM execution to business outcomes
For CXOs, VM performance only matters insofar as it affects revenue, conversion, and brand consistency.
Effective VM dashboards link execution signals with outcome metrics such as:
- Conversion or dwell shifts in affected zones
- Escalation volume and operational noise
- Campaign underperformance despite on time rollout
Even directional correlation is valuable. When leaders can see that certain VM deviations consistently coincide with weaker performance, prioritization becomes obvious.
This is where many VM reporting systems fall short. They report VM in isolation.
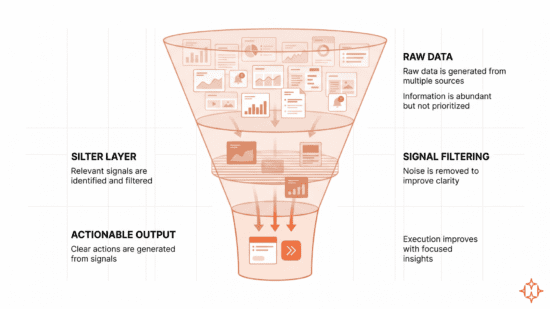
Why fewer metrics often deliver more clarity
One of the most common dashboard mistakes is volume.
Executives do not need more charts. They need fewer, sharper signals.
High performing VM reporting frameworks typically surface:
- A small set of leading indicators
- Trend based views instead of static scores
- Exception driven alerts rather than exhaustive summaries
This allows leadership attention to move from monitoring to intervention.
The role of AI and photo validation in executive reporting
Manual audits and self reported checklists introduce delay and bias.
AI based photo validation changes the nature of VM data itself. Execution quality becomes objective, continuous, and comparable across regions.
For CXOs, this enables:
- Near real time visibility into execution drift
- Early identification of systemic breakdowns
- Confidence that reported compliance reflects reality, not timing
VM dashboards built on validated visual data carry more credibility at the leadership level because they reduce interpretation.
However, the value of better data is only realized when it is translated into decision-ready visibility for leadership.
How HipHip.AI enables decision-ready VM dashboards for retail leaders
The challenge is not the absence of VM data. It is that most reporting systems fail to convert that data into clear signals for leadership action.
HipHip.AI enables VM reporting to function as a decision intelligence layer, not just a monitoring tool.
- Pattern-first dashboard design
Instead of presenting isolated metrics, dashboards surface:
- recurring store-level breakdowns
- frequently failing VM elements
- concentration of issues across regions
This helps leaders quickly identify where structural risk exists.
- Time-based execution visibility
Dashboards incorporate time as a core dimension, allowing leaders to see:
- how long issues persist
- how quickly stores recover
- whether fixes align with business-critical hours
This shifts reporting from static snapshots to operational timelines.
- Exception-driven prioritization
Rather than tracking all stores equally, the system highlights:
- the small subset of stores driving most deviations
- high-risk zones requiring immediate attention
This ensures leadership focus is directed where it creates the most impact.
- Direct linkage to execution signals
Because dashboards are built on validated visual data, leaders gain confidence that:
- reported compliance reflects actual execution
- insights are not biased by timing or self-reporting
The result is a shift from reporting for visibility → reporting for action, where dashboards actively guide where attention should go.
What leading retailers do differently
Retailers that treat VM reporting as a strategic function share a common approach.
They:
- Separate monitoring from enforcement
- Use dashboards to identify patterns, not police stores
- Focus leadership attention on chronic hotspots rather than network wide averages
Over time, this reduces variance, improves compliance sustainability, and lowers the operational cost of VM itself.
VM reporting becomes a lever for scale, not overhead.
Reframing VM reporting as a leadership tool
For retail leaders, the question is no longer whether VM execution can be measured. It is whether VM reporting is helping the organization allocate attention and effort effectively.
Dashboards that simply summarize activity miss the opportunity. Dashboards that reveal patterns change decisions.
For organizations evaluating how AI driven VM validation, time based visibility, and executive level dashboards can improve execution governance across large store networks, you can reach us at [email protected].
About HipHip.AI
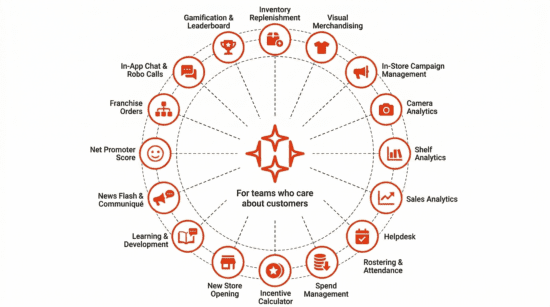
HipHip.AI is an AI-powered, end-to-end retail execution platform used across 10,000+ retail brick and mortar stores. It unifies inventory, merchandising, campaign management, store teams, and store spend into a single operating system—enabling real-time visibility and execution across stores.
Core capabilities include:
- Inventory Replenishment
- Visual Merchandising
- In-Store Campaign Management
- Camera Analytics
- Shelf Analytics
- Sales Analytics
- Helpdesk
- Task Manager
- Rostering & Attendance
- Spend Management
- Incentive Calculator
- New Store Opening
- Learning & Development
- News Flash & Communiqué
- Net Promoter Score
- Franchise Orders
- In-App Chat & Robo Calls
- Gamification & Leaderboard
HipHip.AI integrates seamlessly with existing POS, ERP, WMS, and HRMS systems, ensuring zero disruption to current infrastructure while unlocking smarter, faster retail execution.
Talk to an expert → hiphip.ai
Frequently asked questions
- Why do traditional VM reports fail to support leadership decisions?
Traditional reports focus on activity metrics like compliance percentages and audit scores, which do not reveal patterns, persistence, or root causes of VM breakdowns. - What should CXOs look for in a VM dashboard?
CXOs should look for pattern visibility, time-based insights, concentration of issues, and clear signals on where intervention will have the highest impact. - How does time-based visibility improve VM reporting?
It helps leaders understand how long issues persist, when they are resolved, and whether they impact key business periods, enabling better prioritization. - Why are fewer metrics more effective in VM dashboards?
Too many metrics create noise. A focused set of indicators highlighting trends and exceptions allows leaders to act faster and more confidently. - How does AI-based validation improve dashboard reliability?
AI validation ensures that data is objective and continuously captured, reducing dependency on manual audits or self-reported inputs. - What business impact can improved VM reporting deliver?
Retailers typically see better prioritization of effort, reduced operational inefficiencies, faster issue resolution, and improved consistency across stores.